Amazon Profit Tracker: How to Track Your Real Profit as an FBA Seller
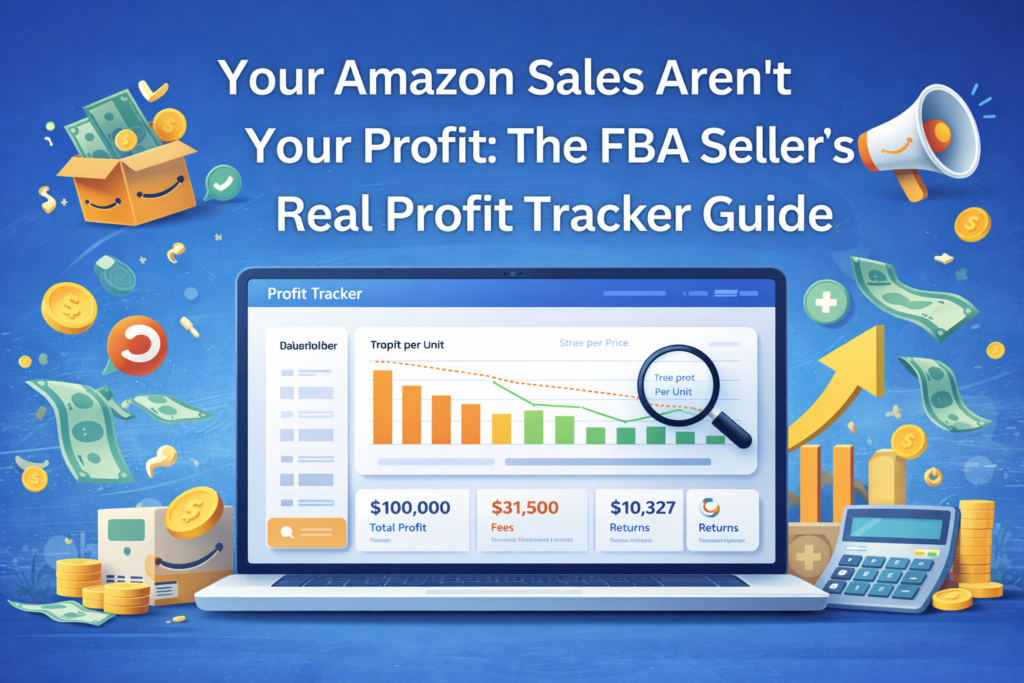
Seller Central says you did $100,000 last month.
Cool… but what did you actually keep?
If you’ve ever looked at a big sales number and still felt cash-tight, you’re not alone. Amazon can be a profit-leaking machine: referral fees, FBA fees, ads, returns, storage, “misc” charges… they add up quietly until a “great month” turns into barely breaking even.
That’s why serious sellers use an Amazon profit tracker—not to admire revenue, but to understand the true profit per unit, per SKU, and per month.
This guide walks you through:
- what profit tracking actually means
- the real profit formula (with the costs most sellers miss)
- the key metrics to watch weekly
- the tools that make tracking automatic (instead of a spreadsheet nightmare)
Because once you can see your real margins, you stop guessing—and you start making decisions that actually move the needle.
What Amazon Profit Tracking Really Means (And Why Most Sellers Get It Wrong)
Amazon profit tracking is simple in theory:
Profit = what’s left after every cost is accounted for.
The problem is most sellers track profit like this:
Revenue – product cost = profit
That’s not profit. That’s a partial math problem.
Real Amazon profitability includes:
- Amazon’s fees (and there are a lot of them)
- advertising spend
- refunds and return processing costs
- storage and aging inventory charges
- inbound shipping / freight (often forgotten)
- removals, relabeling, placement, prep, and random adjustments
Most sellers only track 5–10 cost types. Amazon has dozens. The “missing” costs are where margins quietly disappear.
The Real Amazon Profit Formula (Per Unit)
Here’s the clean way to calculate real profit per unit:
True Profit Per Unit = Sale Price – (COGS + Amazon Fees + Ad Spend + Returns + Storage + Misc Costs)
Let’s break that down in plain English:
1) COGS (Cost of Goods Sold)
This is more than your supplier invoice.
Include:
- product cost
- shipping/freight to Amazon or your prep center
- duties/customs (if applicable)
- packaging or bundle materials
Common mistake: sellers forget inbound freight and duties, which makes margins look better than they are.
2) Referral Fee
Amazon’s commission on the sale (often around 15%, varies by category).
3) FBA Fulfillment Fees
Pick/pack/ship. Depends on size and weight—and changes over time.
4) Storage Fees (Including Q4 Spikes)
Storage gets more expensive in peak season, and aged inventory can get hit with extra surcharges.
5) Ad Spend
Sponsored Products / Brands / Display—your ad costs should be tied to the SKU’s profit, not tracked “somewhere else.”
6) Returns + Refund Costs
Returns are not just “lost revenue.” They come with:
- return processing fees
- refund administration fees
- unsellable inventory losses
7) Miscellaneous Charges
These vary seller-to-seller but commonly include:
- placement and inbound fees
- removal and disposal orders
- label service fees
- reimbursements/adjustments (good or bad)
When sellers calculate this correctly across the catalog, it’s common to discover true profit is 30–50% lower than what they assumed from revenue dashboards.
Why Seller Central “Profit” Isn’t Profit
Seller Central is great at showing:
- revenue
- units
- orders
- traffic
It is not built to show real profitability.
So sellers see $100,000 in sales and assume, “We’re making 20%.”
But after Amazon fees (often a huge portion of revenue), ads, returns, and storage… that $20,000 “profit” can turn into $8,000 (or less).
And it gets worse when:
- Q4 storage jumps
- return-heavy categories spike
- ads get more competitive
- you overstock and get hit with aging inventory fees
If you’re making inventory, pricing, or ad decisions based only on revenue, you’re operating with partial data.
Fees That Quietly Kill Margins (The Ones Sellers Underestimate)
Referral + FBA Fees
Referral fee: Amazon’s cut of every sale.
FBA fees: fulfillment based on size/weight.
These are usually the biggest “known” costs—and still many sellers don’t model them correctly at the SKU level.
Storage + Aged Inventory Charges
Storage is manageable until it isn’t. The real margin killers are:
- seasonal storage increases
- inventory aging surcharges
- slow movers that sit too long
If a product is slow-moving, storage costs can turn a “good SKU” into a money loser.
Returns + Refund Administration Fees
Returns don’t just reverse the sale. They create extra expenses and can permanently reduce recovered fees.
This is why SKU-level tracking matters. One product with a high return rate can quietly drag down your entire month.
The Profit Metrics You Should Actually Watch
If you want clear decisions, track these consistently:
1) Net Profit Margin (Account-Level)
Your overall margin as a percentage of revenue.
Check monthly. If it drops, your job is to find which SKUs or costs caused it.
2) Net Profit Per Unit (SKU-Level)
This is the most important number for decision-making.
It tells you:
- what to reorder
- what to cut
- what to reprice
- what to scale with confidence
3) Contribution Margin
Revenue minus variable costs for that product.
It helps you see which SKUs actually support the business versus just “staying busy.”
4) Break-Even Units
How many units must sell before the SKU covers:
- inventory cost
- ad spend
- fees and operational expenses
Ads + Profit: Track Them Together (Or You’ll Misread Everything)
Advertising isn’t a separate “marketing bucket.” It’s part of profitability.
Watch these alongside SKU profit:
- ACoS: ad spend ÷ ad revenue
- TACoS: ad spend ÷ total revenue (organic + paid)
- Conversion rate: if it’s low, you’re paying for clicks that don’t become sales (and that destroys margin fast)
If your tracker doesn’t connect ads to SKU profit, you’ll make “smart” ad moves that still lose money.
The Reports You Need in Seller Central (If You’re Doing This Manually)
If you’re building a basic tracking sheet, these are the most useful sources:
- Payments Report (most important): shows transactions, fees, and adjustments
- Business Reports: SKU sales, sessions, conversion rate
- FBA Inventory / Aged Inventory: storage exposure and slow movers
- Return Reports: return rates, reasons, disposition
If you want the truth, start with the Payments Report. It’s where the real fee trail lives.
The Best Amazon Profit Tracking Tools
Manual tracking works when you have a small catalog. Once you grow, automation is the only way to stay accurate.
Here are popular options sellers use:
Sellerboard
Strong SKU-level profitability, fee breakdowns, and COGS tracking.
Helium 10 Profits
Best for sellers already using Helium 10 and wanting profit inside the same ecosystem.
FeedbackWhiz Profits
Helpful for sellers selling across multiple marketplaces/channels who want one view.
InventoryLab
Great for wholesale/arbitrage-style buying with batch-level cost tracking.
My Real Profit (Nova)
Designed for near real-time profitability across marketplaces with heavy automation.
Amazon’s Built-In Profit Analytics (Free)
Useful baseline for newer sellers—especially if you keep COGS updated—but typically limited compared to dedicated platforms.
How to Choose the Right Profit Tracker
A simple rule:
- New sellers / small catalog: Amazon tools + spreadsheet
- Growing catalogs: automated profit tracking (SKU-level is non-negotiable)
- High SKU count / multi-marketplace: tool built for scale + consolidated reporting
Then choose based on your model:
- Private label: prioritize COGS and P&L clarity
- Wholesale/arbitrage: prioritize batch-level cost tracking
- Multi-marketplace: prioritize currency + marketplace consolidation
Common Profit Tracking Mistakes (That Cost Sellers Real Money)
- Not updating COGS when supplier costs or shipping changes
- Ignoring returns as a cost category (returns are expensive)
- Only tracking at the account level (losing SKUs get hidden)
- Tracking ads separately from profitability (creates blind spots)
Profit Tracking Makes Repricing Smarter (And Safer)
Once you know true profit per unit, repricing becomes strategic:
- healthy margins → reprice aggressively to win more buy box
- thin margins → set price floors so you don’t sell below true cost
- negative margins → raise price, cut ads, renegotiate costs, or discontinue
When you combine real profit tracking with disciplined pricing, you stop “hoping” your business is profitable—you know.
FAQ: Amazon Profit Tracking
How do I calculate true profit on Amazon?
Use: Sale Price – (COGS + Amazon fees + ad spend + returns + storage + misc costs). Most sellers miss multiple fee categories unless they automate.
Is Amazon’s free tool enough?
It’s a good start for small catalogs, but growing sellers usually need deeper SKU-level reporting, historical tracking, and better cost controls.
How often should I check profit?
SKU-level weekly, account-level monthly. If you run active ad campaigns, check profit impact more often.
Can a profit tracker help inventory decisions?
Yes—profit data plus inventory age/storage exposure prevents slow movers from turning into margin-killers.
What’s the difference between revenue and profit?
Revenue is what customers pay. Profit is what’s left after Amazon fees, COGS, ads, returns, and every other expense. A business can look “busy” and still be unprofitable.